A guest scans your QR code, skims for eight seconds, and makes a decision you feel all shift long.
If you are still judging menu performance by what servers remember and what you 86’d, you are flying half-blind. Restaurant menu analytics turn the menu from a static list into a measurable sales tool. Not “more reports.” Clear signals about what guests look at, what they ignore, and where the money is getting left on the table.
What restaurant menu analytics actually measure
Menu analytics live between marketing metrics and POS reality. They answer a simple set of operator questions: Are guests finding the items we want to sell? Are they hesitating? Are they bailing?
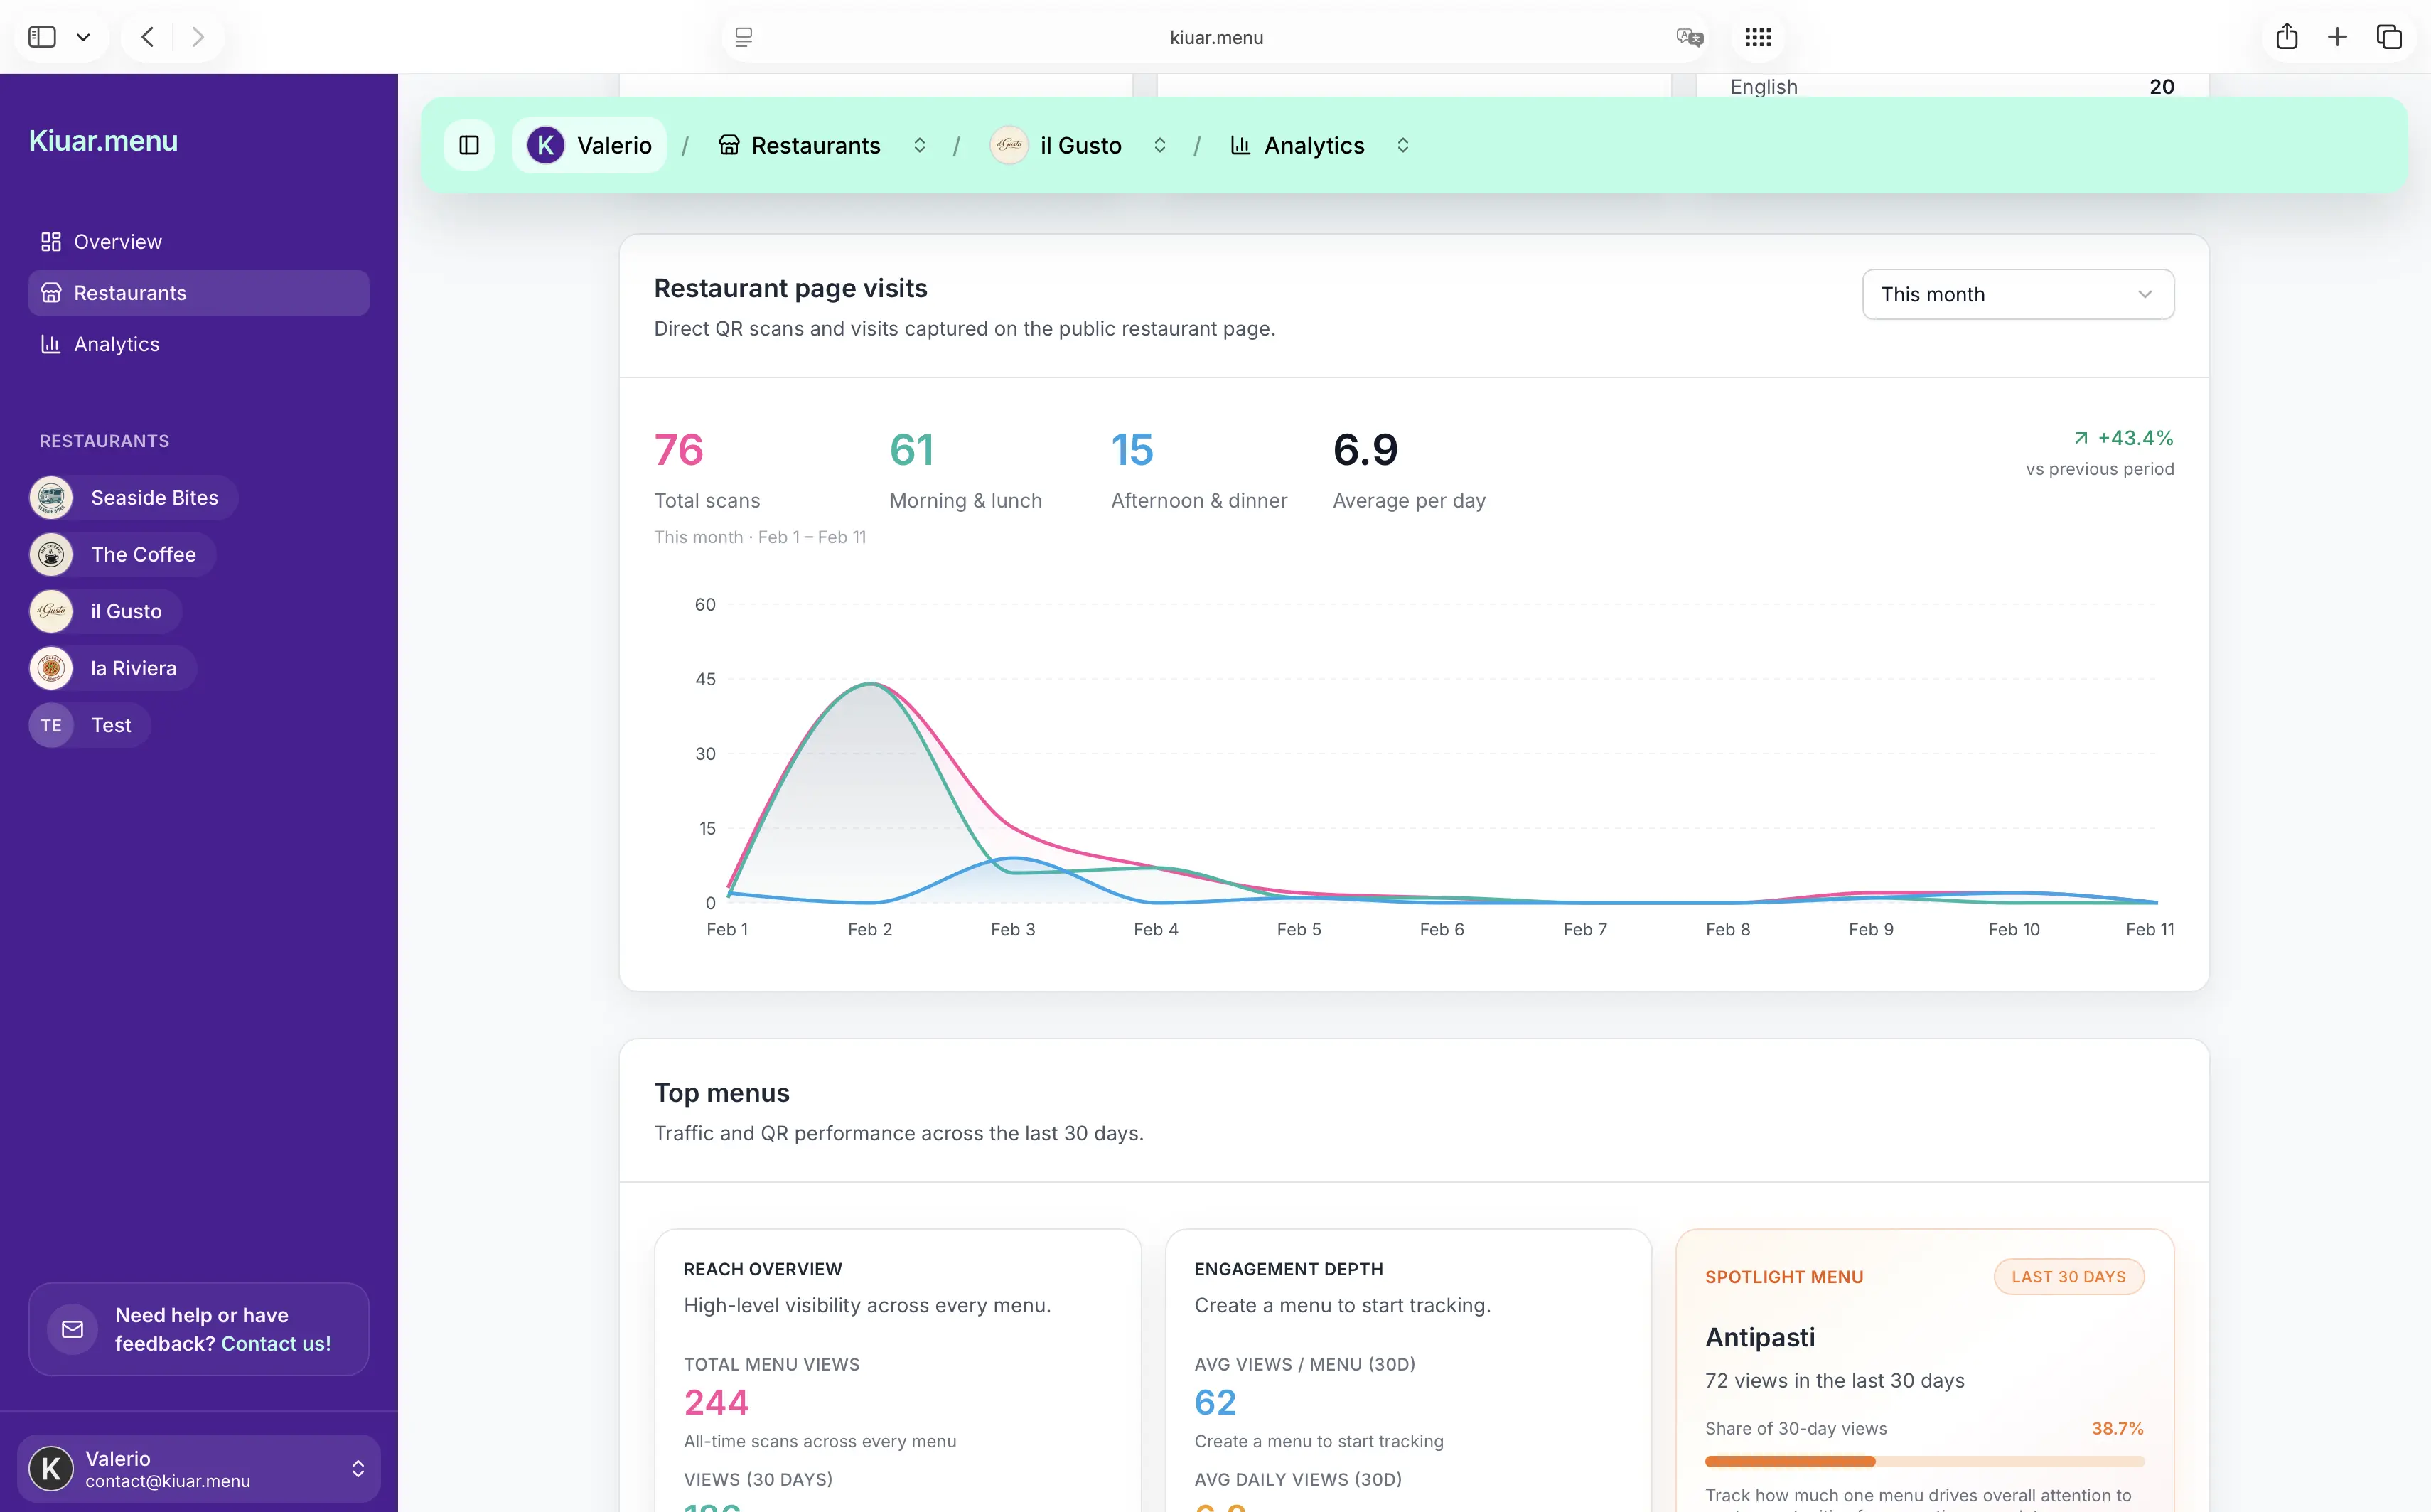
At a practical level, restaurant menu analytics usually include view counts (what pages and items get attention), engagement (taps, expands, language changes, scrolling depth), and sometimes outcomes (orders tied back through POS or by comparing time windows). Even without perfect order attribution, engagement patterns tell you what your guests are shopping for and what is invisible.
The win is speed. You can see a problem mid-week, not at month-end. If a new cocktail list is getting buried or a seasonal special is getting ignored, you can change the menu layout, naming, or placement and watch the numbers move.
Why menus underperform (and it is not always the food)
Most underperforming menus are not suffering from a kitchen problem. They are suffering from a decision problem.
Guests abandon menus when the next step feels hard: too many choices, unclear pricing, inconsistent naming, missing dietary clarity, or translations that read like an apology. That creates a split-second “I’ll just get the usual” reaction. Your best-margin items can be on the menu and still not exist in the guest’s mind.
Menu analytics help you separate “item is unpopular” from “item is hard to notice.” That distinction changes what you fix. If the item is unpopular, you rethink recipe, price, or fit. If it is invisible, you adjust placement, photos, description length, grouping, or labeling.
The metrics that matter for operators
You do not need a dashboard full of graphs. You need a few metrics that map to action.
Item views vs. item taps
Views tell you what is seen. Taps tell you what is considered. If an item gets high views and low taps, it is not earning curiosity. The name might be generic, the description might be doing nothing, or the price might be causing sticker shock.
If an item gets low views and high taps, it is likely buried but compelling. That is a placement problem, not a product problem. Move it up, feature it, or group it differently.
Category performance
Categories are your signposts. If “Burgers” gets heavy traffic and “Salads” gets none, that might reflect your brand, your time of day, or the guest mix. Or it might reflect that “Salads” is stuck at the bottom, behind a long appetizer section.
Category analytics are especially useful for bars and pizzerias. If “Draft Beer” gets attention but “Cocktails” doesn’t, you may have an ordering flow issue (cocktails described with obscure ingredients) rather than demand.
Time and day patterns
Menus behave differently at 12:15 pm than they do at 8:30 pm. If your analytics let you segment by time, you can tighten what appears first based on when people actually order.
This is where operators get real leverage. Lunch guests want speed and clarity. Dinner guests tolerate browsing, but they still hate confusion. If your menu layout is identical all day, you may be optimizing for nobody.
Language and translation usage
If you serve tourists or multilingual neighborhoods, language selection is not a “nice to have.” It is revenue.
Analytics can tell you how often guests switch languages and which languages are used most. That helps you decide what to translate first, where to place the language switch, and whether certain descriptions are confusing even in English.
A trade-off: more languages can increase reach, but it also adds operational responsibility. If you change an item name or allergens, you need that change consistent across languages. Analytics tell you whether the effort is paying off.
Dietary and allergen label interactions
Guests with dietary needs scan differently. They look for certainty.
If you label gluten-free, vegan, dairy-free, or allergens, watch what gets filtered or tapped. When a dish is frequently checked for allergens but rarely ordered, it might be too risky or unclear. A tighter description and cleaner labeling can turn “maybe” into “yes.”
Turning insights into changes that actually move sales
Analytics are only valuable if you can edit fast. The best workflow is: spot a pattern, make a small change, check results.
Fix “high view, low tap” items first
These are your easiest wins because people are already seeing them. Try one change at a time.
Start with the name. If it is “House Chicken,” you are forcing guests to guess. A more specific name that signals flavor and format often raises engagement without changing the dish.
Then look at price presentation. Guests do not hate high prices. They hate surprises. If your $26 pasta looks like a standard bowl and reads like a standard bowl, people bounce. Add the reason it is worth it: handmade, local, larger portion, premium protein.
Use placement like you mean it
Your menu has a top. That top sells.
If analytics show your highest-margin items are getting fewer views than your lowest-margin items, that is not a mystery. Reorder categories, bring featured items closer to the starting screen, and shorten long sections that push good items below the scroll.
It depends on your concept. A food truck might need “Top Sellers” first, then everything else. A cocktail bar might lead with “Signature Cocktails” and tuck classics behind. Analytics tell you what guests actually browse, not what you hoped they would.
Treat photos as a test, not a decoration
Photos can lift sales or slow decisions. Some concepts benefit from images, especially quick-service and desserts. Other concepts suffer when every item has a photo and the page becomes noise.
If you add photos, track whether taps and time-to-decision improve. If guests spend longer browsing but order less, you may be distracting them.
Tighten descriptions for mobile reading
Most guests read on a phone, in bad lighting, with a conversation happening.
If a section has lots of views but low engagement, your descriptions may be too long. Cut filler, lead with what the item is, and save details for the end. Analytics will show whether guests start tapping again once the menu becomes scannable.
Menu analytics for multi-location operators
Multi-location menus fail in predictable ways: inconsistent naming, different prices for the same item, and updates that roll out unevenly.
Menu analytics can highlight location-level differences. If a burger gets strong engagement at Location A and weak engagement at Location B, you can dig in. Is the item placed differently? Is it priced higher? Is the audience different at that daypart? Or is staff pushing a different item?
The caution here is overreacting to small samples. A slow Tuesday at one store does not justify a system-wide menu change. Look for repeat patterns across weeks or across similar locations.
The operational reality: analytics are useless if updates are slow
Most operators do not have time for a long “analysis phase.” You need a toolchain that lets you act in minutes.
That is why digital menus pair naturally with restaurant menu analytics. If you can edit once and publish instantly, you can respond to what the data is telling you while it still matters. Out of an item mid-service? Hide it. Seeing low engagement on a new special? Rename it or feature it higher before the weekend rush.
If you want a practical way to combine fast edits, branding control, translation, dietary labeling, and analytics under one subscription, Kiuar.menu is built for exactly that workflow - start free, publish when you are ready.
Common mistakes that make menu analytics misleading
Analytics do not magically equal truth. A few pitfalls can send you in the wrong direction.
One is confusing views with intent. A category might get lots of views because it is first, not because it is wanted. Another is making multiple menu changes at once, then not knowing what worked. Change one variable, then measure.
Also watch for QR placement issues. If some tables have codes in awkward positions, you will see lower menu traffic that looks like a menu problem but is actually a signage problem.
Finally, do not ignore staff behavior. Server recommendations can overwhelm menu design. If analytics show guests are not looking at desserts but your dessert sales are high, that might be great server work. If sales are low and views are low, you have a visibility issue. Same symptom, different cause.
A simple rhythm that keeps menus profitable
The most effective operators treat menu optimization like prep, not like a special project.
Pick one day each week to check menu analytics for three things: items that are getting seen but not considered, categories that are being skipped, and any language or dietary interactions that suggest confusion. Make one or two edits, publish, and let the next few days of traffic tell you if you helped the guest choose faster.
A menu is not a poster. It is a living tool that should change when your inventory changes, when your prices change, and when your guests change. The best part of restaurant menu analytics is not the data itself - it is the confidence to make small, smart updates without second-guessing every decision.