You can feel it happening on a busy shift: the same questions repeat, the same items get name-dropped, and one page of the menu seems to hold the whole room hostage.
That instinct is useful - but it is not measurable.
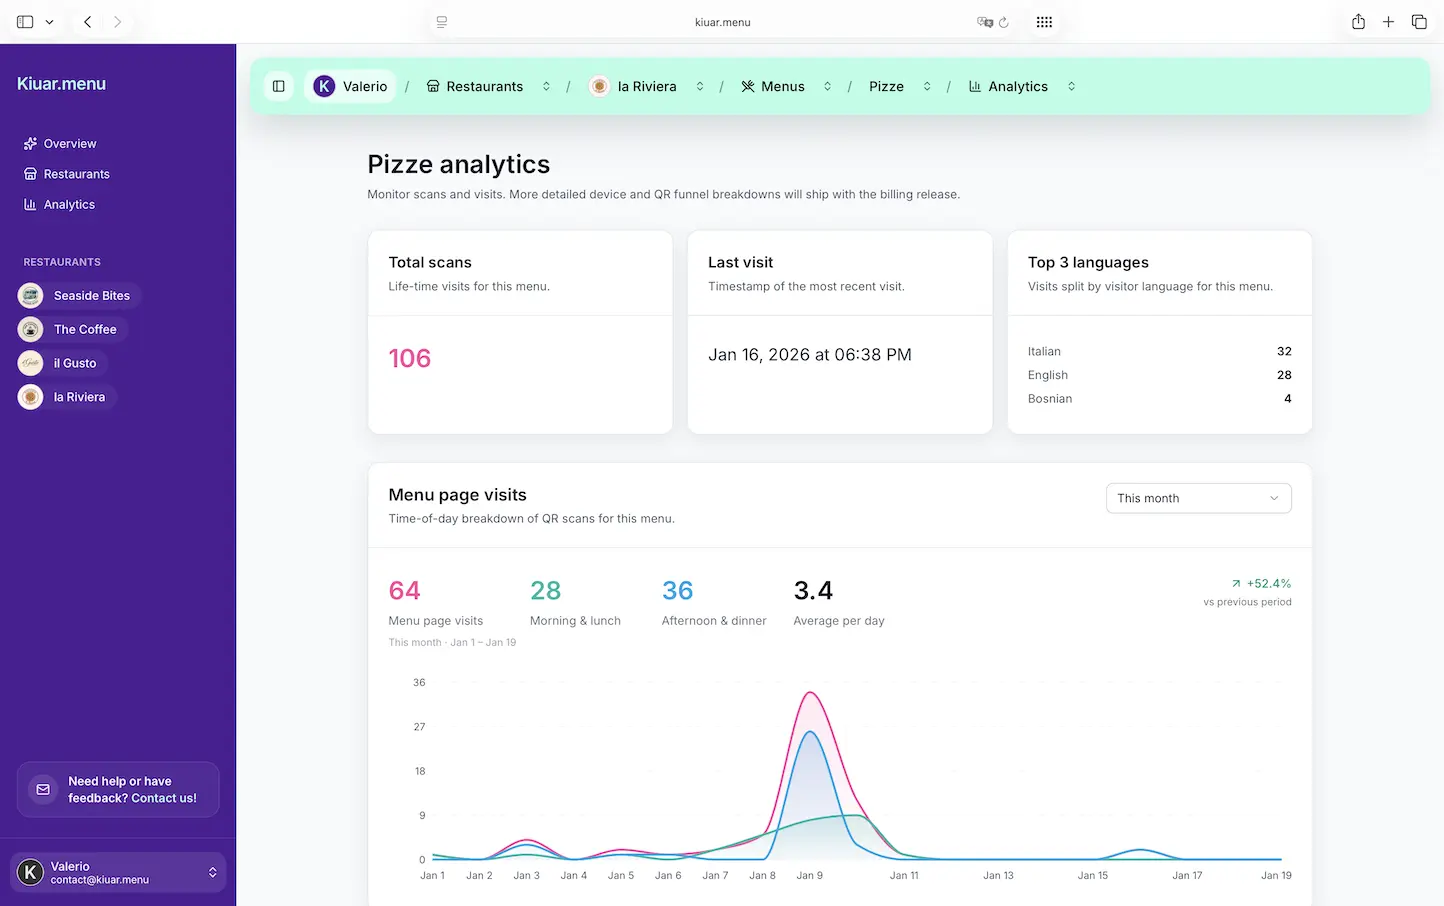
When you track most viewed menu items analytics, you stop guessing what guests are considering and start seeing it. Not just what sells at the POS, but what gets attention before a server ever takes an order. For operators, that difference is pure leverage: better menu layout, smarter 86 decisions, and fewer missed opportunities when an item is getting a ton of interest but not converting.
What “most viewed” actually means (and why it is not the same as “best seller”)
Most viewed items are the dishes guests look at the most on your digital menu. That sounds obvious, but the operational value comes from what it suggests: intent.
A best seller is the end of the story - the item was ordered. A most viewed item is the beginning and middle - the item was considered. Sometimes those two overlap. Often, they do not.
If a dish is highly viewed but not ordered much, something is getting in the way. It might be price, unclear description, missing photo, dietary concerns, or a modifier that is confusing. If an item is ordered frequently but not viewed much, it may be getting ordered from memory (regulars), recommended by staff, or buried in a place people do not browse.
Most viewed analytics are especially valuable for:
- New menus, seasonal menus, and pop-ups where you do not have months of sales history.
- Bars and cafés where guests scan, skim, and decide fast.
- Multi-language menus where translation quality can directly change conversion.
The practical setup: how to track most viewed menu items analytics
If your menu lives on paper, you cannot track views. If your menu is a PDF hosted online, you might track page views, but you will not reliably see item-level behavior. Item-level analytics typically require a digital menu experience where each item, category, or interaction is trackable.
That is the first decision: what are you tracking, and how granular do you need it?
At a minimum, you want item views by time period. Better is item views plus category views, plus clicks into item details (if your menu supports that), plus language selection, plus device type. Those extra layers help you separate “the whole menu is getting more traffic” from “this specific dish is getting attention.”
Once you have item-level tracking available, the setup is less about code and more about operational consistency.
Define what counts as a “view”
Different platforms define views differently. Some count a view when an item is visible on the screen. Others count when a guest taps an item. Those are not the same.
Visibility-based views can be inflated by scrolling behavior. Tap-based views can undercount curiosity if guests read the list without opening details. Neither is wrong, but you need to know which you are looking at so you do not overreact.
If your menu offers both list browsing and item detail pages, a good pattern is to treat list visibility as “impressions” and detail taps as “deep interest.” When both are high, you have a true attention magnet.
Segment by location and time, not just totals
Totals hide the shift-level story. A brunch item may dominate from 10 a.m. to 2 p.m. and disappear at night. A spicy wing flavor might spike during games. A dessert may get attention late but lose out to faster checkout.
Set your default view to something an operator can act on: today, last 7 days, and last 28 days. Then compare weekday vs weekend. If you are multi-location, separate the data by location first. Otherwise, one neighborhood can distort decisions for the entire group.
Tie “most viewed” to availability and 86 events
This is where analytics becomes operational, not academic.
If an item is most viewed and you 86 it mid-service, that is friction. Guests see it, want it, and then hit a dead end. On a digital menu, you can react instantly by hiding it, marking it sold out, or swapping in a suggested alternative. The best systems let you make that edit once and have every QR code reflect it immediately.
Over time, track patterns: which items become most viewed right before they run out. That is a forecasting signal you can use for prep and ordering.
How to interpret the data without fooling yourself
Menu analytics can be dangerously persuasive. A number goes up, and it feels like a win. But “most viewed” is only valuable when you read it with context.
High views + low orders: the “menu leak”
This is the most common and most fixable insight.
If an item gets a lot of attention but does not sell, ask what a guest needs to say “yes.” Sometimes the fix is simple: clarify what it is.
- If the name is clever but unclear, add one plain-English line.
- If the price is the issue, consider whether the value is communicated (portion size, premium ingredient, add-ons included).
- If dietary questions are blocking orders, make allergens and labels obvious.
This is also where translation matters. If you serve tourists or multilingual neighborhoods, a slightly off translation can turn a high-interest item into a no-order item. When you can see item views by language, you can catch that fast.
High views + high orders: protect and feature it
When an item is both viewed and ordered a lot, treat it like a core asset.
Make sure it is always in stock. Make sure the description is consistent across languages. Make sure photos and modifiers do not add friction. And be careful with price increases. A small bump can be fine, but if you change the price, watch what happens to views and orders in the same week. If views stay high and orders dip, the increase may have pushed guests into “considering” but not “committing.”
Low views + high margin: decide if it deserves attention
Some items make you money but do not get browsed. That is not automatically bad, but it is a choice.
If servers sell it through recommendations, you might leave it alone. If you want it to sell without staff effort, it needs visibility. Menu layout, category placement, and naming can change that.
This is where most viewed analytics supports menu engineering without turning your menu into a spreadsheet. You are not trying to force every guest into the same order. You are removing unnecessary friction for the items you want to grow.
The biggest levers you can pull once you know what is most viewed
1) Layout and category order
Guests do not read menus like books. They skim. They bounce between sections. They look for anchors: “Signature,” “Popular,” “Gluten-free,” “Cocktails.”
If your most viewed items live in a category that is too low on the page, move that category up. If your category is getting views but items are not, the category title may be vague.
Small edits matter because digital menus update instantly. You can test a change this weekend and learn by Monday.
2) Description clarity (not more words)
Operators sometimes respond to low conversion by adding paragraphs. That usually backfires.
The goal is fast confidence. One tight line that answers “what is it?” beats three lines of poetry. If an item is most viewed, it is already getting attention. Your job is to help the guest decide.
3) Photos, used selectively
Photos can increase conversion, but they can also slow down browsing and make the menu feel cheap if the quality is inconsistent.
Use photos where the data suggests uncertainty. A highly viewed item with low orders is a better candidate for a photo than a steady best seller. If you add a photo, watch whether deep interest (taps) and orders change, not just views.
4) Pricing tests without chaos
Pricing is sensitive, and constant changes annoy regulars. But there is a reasonable middle ground: make a change, then measure.
If you raise the price on a most viewed item, check whether views stay steady. If views drop, you may have lost attention. If views stay high but orders drop, guests still want it but the price is stopping them. That tells you to adjust value communication or consider a different price point.
5) Smart availability messaging
Nothing frustrates a guest like falling in love with a dish and then realizing it is not available.
If you cannot fulfill it, mark it sold out. If it is time-bound, label it. If it is limited, say so. Most viewed analytics helps you identify which items need the cleanest availability handling because the most guests will run into that moment.
“It depends” scenarios operators should plan for
Most viewed data is not always about what guests want to eat.
Sometimes it is driven by confusion. Guests may open an item repeatedly because the name is unclear, or because they are looking for sides and modifiers are buried.
Sometimes it is driven by sticker shock. Guests may click an item because it sounds great, then back out when they see the price.
Sometimes it is driven by social behavior. One person at a table may be browsing for everyone, driving views up while orders stay normal.
That is why the best habit is to treat most viewed analytics as a shortlist of “items to inspect,” not an automatic decision engine. It tells you where to look, then your operational judgment finishes the job.
Where Kiuar.menu fits (if you want this without extra tools)
If you want item-level visibility without designers, PDFs, or separate translation workflows, a QR menu platform that combines editing, branding, languages, labels, and analytics in one place can keep things simple. Kiuar.menu is built for that operator reality: change an item once, publish in seconds, and let menu analytics show you what guests are actually looking at - including the items that get attention before they ever get ordered.
A helpful way to think about it is this: your POS tells you what happened. Menu analytics shows you what almost happened.
A closing thought to use on your next shift
Pick one item that is getting a surprising amount of views this week, and change only one thing about how it appears on the menu - a clearer description, a stronger label, a better placement, or a sold-out toggle when needed. Then watch what the guests do next. The win is not the change itself. The win is building a menu you can actually steer, in real time, with evidence instead of hunches.